Google Analytics 4 (GA4) represents the next evolution in web and app analytics, offering a comprehensive solution that unifies tracking across platforms while embracing privacy-first principles. With GA4, businesses can gain deep insights into user behavior across both websites and apps, thanks to advanced machine learning and event-based tracking. This guide is designed to help you navigate the key features, setup processes, and reporting tools within GA4, ensuring you can leverage its powerful capabilities to drive data-informed decisions and future-proof your analytics strategy.
Table of contents
What exactly is Google Analytics 4?
A major advantage of Google Analytics 4 is that you can use it for insights on a website, an app, or a website and an app together. This version expands and rebrands what App + Web was offering.
Google describes GA4 as a next-generation approach to privacy-first tracking, cross-channel management, and AI-based predictive data, all together in one platform. Google Analytics 4 is heavy on Google’s machine learning models – for example, it can propagate data for website traffic and user behavior without having to rely on hits coming from every page.

There are some key goals that Google Analytics 4 aims to meet:
- Shift the way data is shown toward a focus on users and the user journey.
- Track “events” – these are the main way data is presented in Google Analytics 4.
- Use machine learning technology to fill in the gaps for business owners or marketers when trying to make sense of your data. For example, what can you learn about customers who opt-out of data collection or cookie usage? /
Why is all of this important?
Privacy laws (such as Europe’s GDPR and iOs14), have diminished the stability or reliability of the older analytics package. If you’ve ever found your data to be inaccurate or missing key parts, it is often due to users declining to give consent for cookies. Google Analytics 4 has a way around this by using data modeling to extrapolate and make assumptions based on existing data and user behaviors.
Google Analytics 4 is designed to future-proof the analytics function so that you will still be able to glean useful insights from it.
Google Analytics 4 Features
Google Analytics 4 (GA4) uses a dynamic measure model that allows you to get a more granular and flexible way to measure user engagement across your website. You can tailor the tracking to meet your needs, while also being provided with the basics right out of the gate. This flexibility, combined with features like machine learning and Google Ads integration, makes GA4 a powerful tool for understanding and optimizing user behavior. Let’s breakdown GA4.
The measurement model
Google Analytics 4’s measurement model is based on events and parameters. In this case, even a pageview is considered to be an event. Every activity the user goes through will be considered an event in GA4.
Google Analytics 4 comes with predefined events, but you can add more.
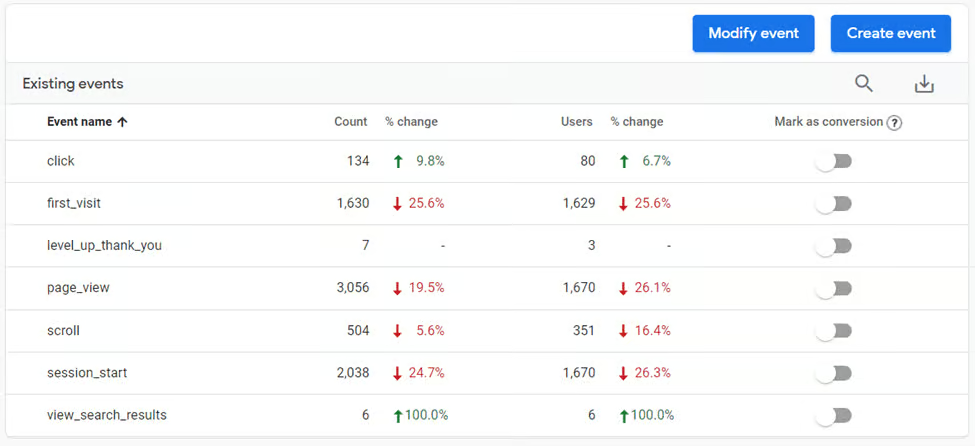
Events
Google Analytics 4 events fall into four categories:
- Automatically Collected Events: These are automatically logged from the gtag or gtm configuration. These standard events include first_visit, page_view, session_start, and user_engagment.
- Enhanced Measurement Events: These are a special set of events that can be enabled or disabled via the GA4 interface. Events include file_download, scroll, and video_start.
- Recommended Events: These are events with predefined names and parameters that are recommended for different business types. These events require additional code changes either through Google Tag Manager or code modifications on the page. (Google’s support documentation includes some recommended events for different business types)
- Custom Event: These are events that you name and implement yourself. These events also require similar modifications to the standard tracking code as outlined in Recommended Events.
The type of GA4 tracking events you implement will be dependent on your business. But the following are GA4 predefined events that we generally recommend setting up for all properties:
- Generate_lead
- Sign_up
- Select_content
If you have an eCommerce site we also recommend:
- Purchase
- Begin_checkout
- Select_promotion
Google Tag Manager will allow you to send custom events to Google Analytics 4 when you set up the tag type “GA4 Event”.
Engagement rate
Google Analytics uses a metric called engagement rate. This measurement consists of engaged sessions and the criteria within the session must result in one of the following: a conversion, a session length of more than 10 seconds, or multiple screen or page views.
User and event data retention

How long do you keep your user-specific data?
In Google Analytics 4, you have the choice of either 2 months or 14 months. The data retention will only affect your exploration and funnel reporting (more on this later). When using your aggregated reports, you will be able to access data as early as the first instance of GA4 data collection. Data will be cleaned up monthly to fall in line with the retention timeframes. Increasing your retention period will only apply to the collected data moving forward, not to anything that has previously been deleted. If you don’t see your change right away don’t worry, it takes up to 24 hours for Google to implement this change, which also allows you to revert your change if you didn’t mean to make this update.
Ecommerce users
With ecommerce events set up you’ll be able to see ecommerce measurement in GA4, which tells you how your customers are interacting with the shop. If you have just implemented these events it will take between 24 and 48 hours to see user data begin to populate in GA4. Knowing your customer’s interests is half the battle. Once you know this data you can make educated changes to your storefront and campaigns to improve sales and events.
Machine Learning
Machine learning insights in GA4 have analysis technology without requiring additional complex tracking code edits. These insights and predictions from the AI behind GA4 can help marketers by automatically providing alerts for data trends. For example, you might receive an alert if the predictions show a surge in demand for a product that you sell.
The AI technology is also very useful for predicting other sorts of outcomes that are important to marketers. For example, you might get a prediction of churn rates, or you might get customer segment-specific predictions to help you hone your strategies. An example could include a prediction for an uplift in revenue from a key segment. You could then focus on actions that target that high-value audience.
Trend Watch: AI For Rapid Creative Testing
Running multiple versions of your creative content has long been a best practice for marketers. This type of A/B testing allows you to put your content in front of a live audience and see what they respond to in real-time. The time needed to create multiple versions is often a hindrance however, and it can be tempting to just come up with one iteration and roll with it.
The good news is there’s a new ally in the fight against stale content – Artificial Intelligence! Emerging tools such as anyword allow you to enter basic information such as a product name, description and keywords and then the AI will analyze it and generate multiple marketing copy variations for you. You can now share the load when it comes to brainstorming new ideas, allowing you to rapidly test content in the never-ending quest for increased conversion rates.
Audience integration with Google Ads
How valuable is it to you to be able to build and maintain more in-depth audience lists? What if you could see exactly what actions people have taken so that you can avoid showing them unnecessary remarketing ads?
That’s exactly what you can do with Google Analytics 4. Say a person has qualified for your Google Ads audience due to an action they’ve taken. You can automatically have them removed from the list for that campaign once they’ve taken an action that achieves the campaign goal. This functionality can significantly help to streamline the process and prevent unnecessary ad spend.
Reporting
Reports look at the customer lifecycle and aim to give you a more complete view of how customers are engaging with your business across different channels and devices. The reporting interface provides a unified perspective across your website and app visitors, helping to give a more holistic view. Reporting reflects event driven marketing.
Here are some insights on reporting and key reports you should know about:
Demographics reporting
The intent of demographics reporting is to give you a high-level overview of the age and gender of your users, as well as the countries, regions, or cities they are coming from when they use your website or app.
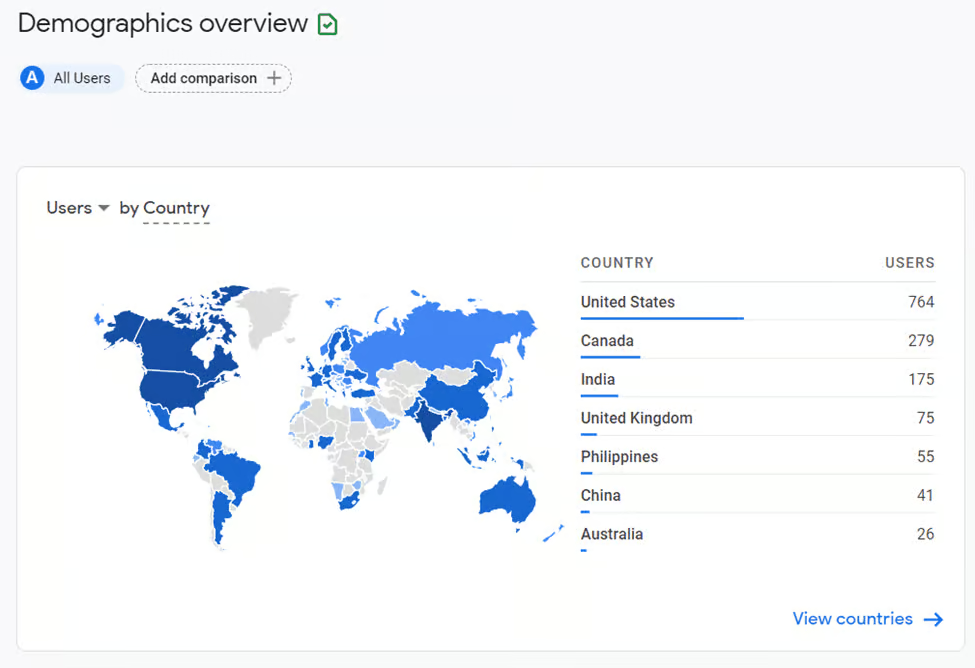
This report has enhanced features, such as optimized visualizations for user interests and geographic reports. A good example is that you can see scatter plots when you take a deeper dive into interests. These can show you how interests have trended over time.
For marketers, this offers a simple way to visualize the relationships between two dimensions.
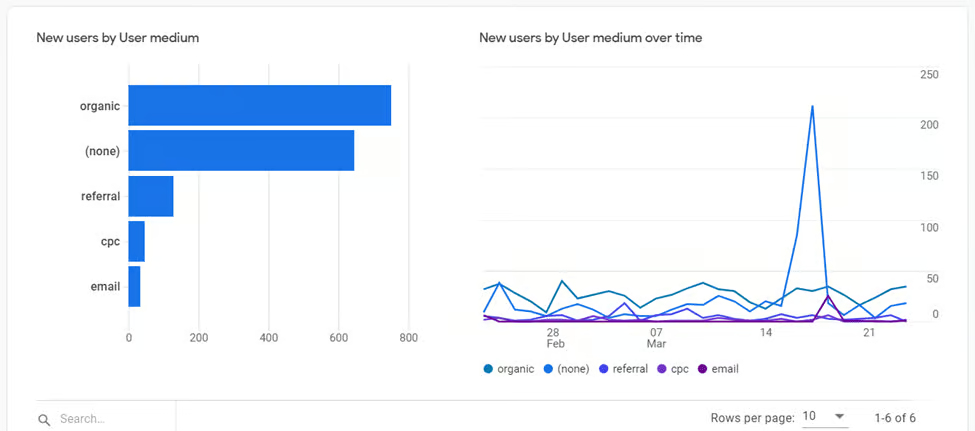
User reporting
The Users Report has information such as new and returning user metrics and trends, acquisition dimensions and retention metrics.
At the bottom of each widget in your reporting, you can click on a blue call to action to get into more information. For example, under acquisition reporting, you can click on “view new users”.
There are some metrics to be aware of under user reporting as well. These include:
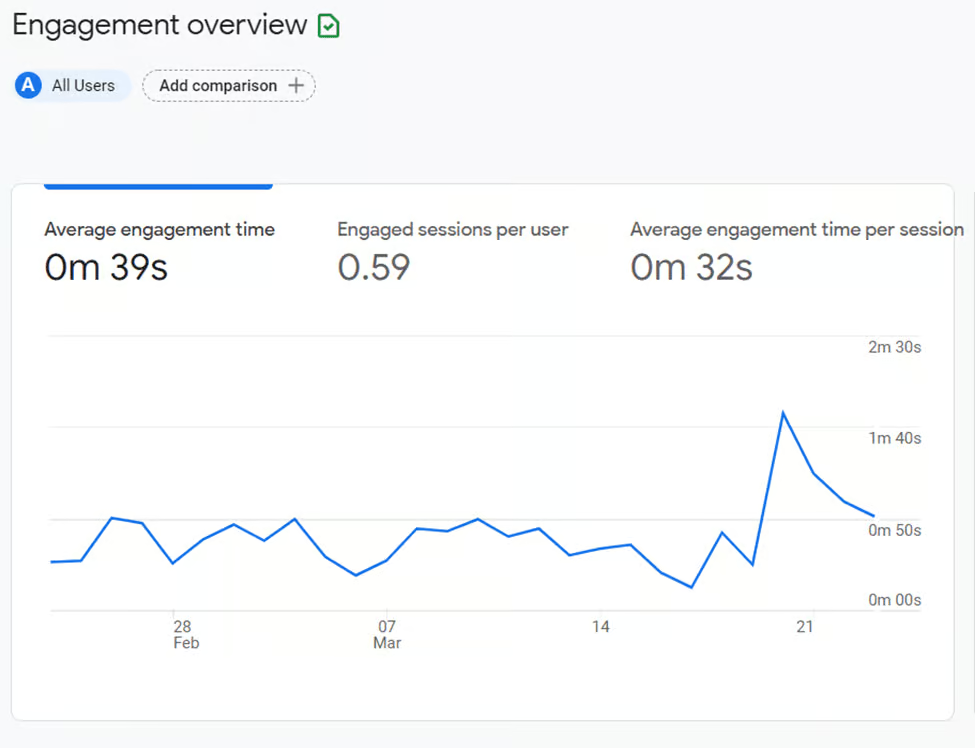
- Engaged sessions: This is defined by any user who has been on your site for 10 seconds or more.
- Engaged sessions per user: This is the sum of the total number of sessions per user averaged by total user count. This measure will be something for marketers to watch trends over time – a higher ratio means more engaged users.
- Engagement time: Engagement time diagnoses screen sleep time, or captures the time in the foreground for a mobile device, to determine how a user is engaging with your content.
Behavior reporting
Behavior reporting is broken down into events and page views or screen views in Google Analytics 4. You can view these metrics in the engagement reporting section of reporting. When you understand the users’ behavior, you can identify what is working and what’s not and improve the user experience.
Technology reporting
Technology reporting gives you insights into the technology your users are channeling to get to your site or app. This includes device types, browser types, and operating systems, among other things. There are two sections in this report: web technologies and app technologies.
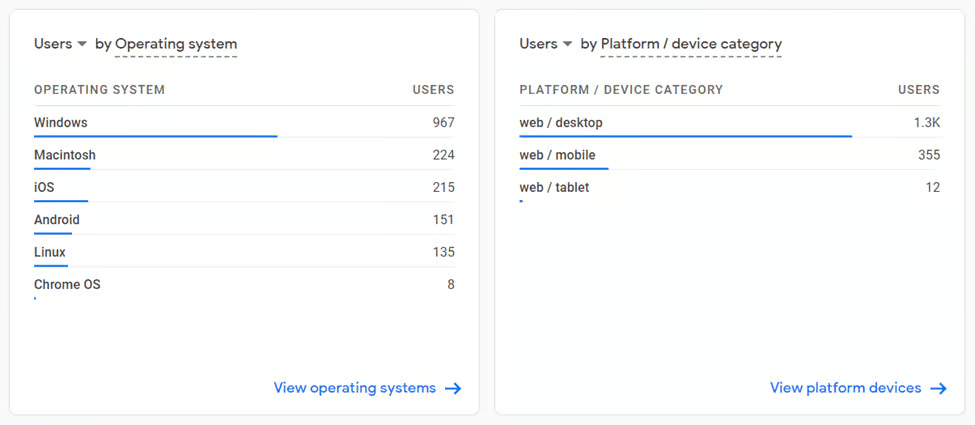
Google Analytics 4 has mobile app reporting. This includes details like app version, release, device model, and platform (iOS vs. Android, for example).
Tracking web and mobile app data
Under Google Analytics 4, web and mobile app data is brought together – you can view, track and manage it all in one platform. While most of our guide covers website reporting, there are specific reports available for apps such as games reporting and app developer reporting. These reporting features operate similarly to website reporting in that you can gain a deeper understanding of your users.
Funnels for everyone
As a marketer, you recognize the value in utilizing funnels to identify, target and deliver relevant content at different stages of your customer’s journey
Using funnel analysis in GA4, marketers can create new funnels and test how they look on the fly. Old data will be processed immediately and let you identify new areas you may want to add into a funnel. Also, the funnel analysis tool allows you to view segments and steps together.
Export to BigQuery
With Google Analytics 4, all users can export data directly to BigQuery.
Why is this important for marketers? The integration allows you to get raw event data directly into a data warehouse, giving you the ability to create all sorts of customizations to suit your business. Having your data in BigQuery gives you the ability to slice and dice your data in infinite ways and integrate the data directly into dashboards and your own reporting platforms.
Codeless event tracking
Setting up code or adding event tracking in Google Tag Manager can be time-consuming and challenging for marketers. GA4 offers you another way. Expanded codeless features mean you can track and measure onsite and in-app actions that you need to know about. Nearly all typical events and variables on the site: css selectors, scrolling, clicks, form submits, etc., are already being recorded as a default feature of the tagging. It is a much simpler task to now go into the reporting and simply identify which events to record, without the need for additional coding.
Key Tool: Google Tag Manager
Since it was first launched in May 2016, Google Tag Manager has become one of the more important tools in a webmaster’s toolbox. Its ability to help you manage tags in a fast and efficient way is truly a timesaver, and can be even more useful if you’re not really into coding. Having one place to create and manage all of your tags removes the need to manually code each tag on your website. Gone are the days of needing to rely upon your development team to implement new tracking code!
Tags can serve a variety of functions on your website, from embedding third-party JavaScript code to implementing your Google Analytics ID or Facebook Pixel. Google Tag Manager also makes things easier to implement GA4 – you can easily run your new GA4 tracking code.
Setting up Google Analytics 4
If you’re thinking about setting up GA4 you might have questions like how do I get GA4?

The good news is that it’s pretty easy to create a Google Analytics 4 account. In this section of the guide, we will walk you through the steps needed to set up Google Analytics 4 including tracking using Google Tag Manager.
If you’re going to set up a Google Analytics 4 property, here are the steps:
- Visit https://analytics.google.com/.
- Go to the Admin section.
- If you haven’t already set up an Account, click Create and then select Account. If you already have an Account click on Create and then Property, then skip to step 6.
- Give the Account a Name that accurately represents the business entity you are looking to add.
- Click Next to add your first property.
- Enter a name for the business property and select your business time zone, industry category, business size, and your intentions of use for Google Analytics (this will set up reports for you based on what you think you will want to know).
- Click Create. If you set up a new account you will also be prompted to accept the Analytics Terms of Service and Data Processing Amendment.
- Select “Add a data stream.”
- Click IOS app, Android App, or Web.
- Enter the correct domain, give it a name, and click “Create stream.”
- Copy the Measurement ID.
- Go to Google Tag Manager. If you already have an account skip to step 15.
- Select Create Account and give the account a name, container name, and target platform.
- You’ll be given a Google Tag Manager Installation code with various options for installation. Install this code yourself or have your web/app developer install it.
- Once in your container select New Tag. We recommend naming this tag GA4 Configuration.
- In the tag configuration select Google Analytics: GA4 Configuration then paste the measurement id from Google Analytics that you previously copied. *Note you will most likely want to have “Send a page view event when this configuration loads” checked since you will likely want to automatically track pageviews.
- Next you will want to set up the trigger. In most instances you will want to select All Pages for the trigger.
- Select Preview in the top right to ensure the tag is firing properly. To do this enter your website URL and hit connect. When this opens in a new tab you should see the new GA4 configuration Tag.
- If the preview looked good then close out of debug mode and hit Submit and then Publish to push the change live.
- Lastly, we recommend visiting your website to generate traffic and then go back to your GA4 profile. Look at the real-time traffic report to see if your view is showing up. *Note this can sometimes take up to 10 minutes to start appearing.
Where can you get more information about Google Analytics 4?
Google’s documentation is the best place to get the most up-to-date information. Here are some to start with:
- Google Analytics 4 Hierarchy
- Get Started with Explorations
- Google Analytics 4 Reporting
- Link Google Ads & Google Analytics
- Create, edit, and archive audiences
Google Analytics 4 is the future of Analytics. It will allow you to gain better insights, even where tracking and other traditional methods of gathering data are not available, and the AI properties are a great feature, making the most of this growing technology.
Are you wanting to take advantage of Google Analytics 4 but you’re not sure of your next move or don’t have time to research and implement? We get it. Analytics is a large and constantly-changing topic and it’s important to make sure you’re implementing it the right way so you have access to and can accurately interpret and use data that’s important to you and your business.
Our experienced team implements and optimizes Google Analytics 4 and Google Tag Manager configurations to deliver custom dashboards, reports, and data that’s most important to your business needs and goals. Thoughtful planning and integration with other marketing efforts, such as PPC campaigns and specific traffic sources, will give you a holistic view of our digital marketing efforts and is one of our specialties.
You’ll have access to real-time data and monthly generated reports to share with internal stakeholders and help inform and direct strategy, appropriate marketing spend, and identify and deploy tactics to reach and exceed goals.
We’re committed to continuing to serve as Google Analytics experts and will review, advise on, and leverage new developments and features as they’re released. We look forward to partnering with you to implement and advance your digital marketing initiatives and supporting your success.
Marketing Guides


Stay connected with updates on our work, what we’re learning, and life behind the scenes at Paragon.