GA4 offers many reports you’ll be familiar with and some that are new or slightly different.
The new reporting interface provides a unified perspective across your website and app visitors, helping to give a more holistic view.
One of the first differences you’ll notice is that Google Analytics 4 moves away from the traditional “ABCs” (Audience, Acquisition, Behavior, and Conversion) that you’re used to seeing in Universal Analytics. Reporting now reflects the shift in logic to event-driven marketing.
If you were to compare data from your current Universal Analytics reports to a new setup with GA4, you’re likely to spot that numbers on reports aren’t an exact match between the two. This is to be expected due to Google Analytics 4 being event-driven while Universal Analytics is session-driven.
Here are some key reports to review:
Demographics reporting
The intent of demographics reporting is to give you a high-level overview of the age and gender of your users, as well as the countries, regions, or cities they are coming from when they use your website or app.
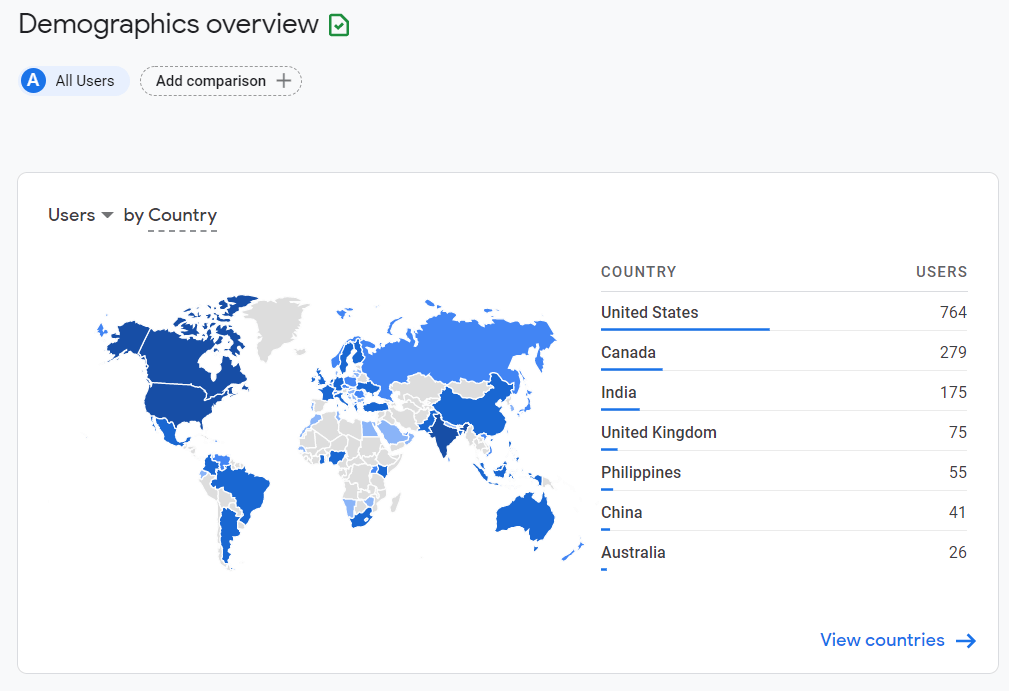
This report has a lot of similar information to what you’ve seen with Universal Analytics, but it also has enhanced features, such as optimized visualizations for user interests and geographic reports. A good example is that you now can see scatter plots when you take a deeper dive into interests. These can show you how interests have trended over time.
For marketers, this offers a simple way to visualize the relationships between two dimensions.
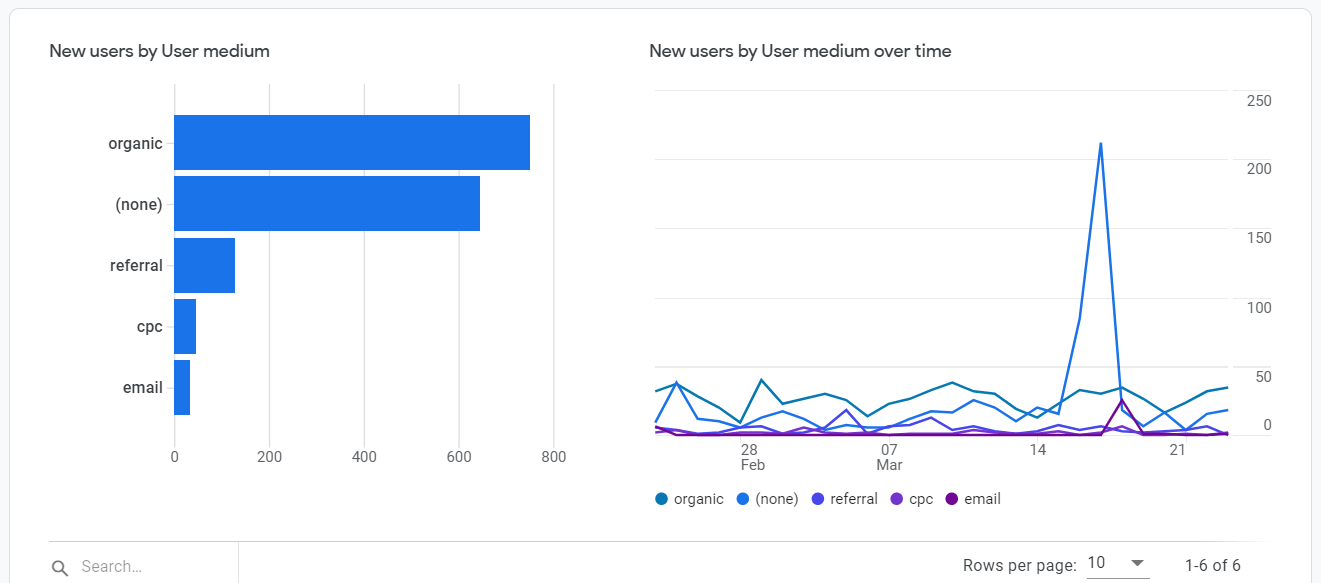
User reporting
The Users Report has a lot of the same information you currently see in Universal Analytics, such as new and returning user metrics and trends. A major change is that it now includes acquisition dimensions and new retention metrics.
Overall, Google Analytics 4 reports allow you to get into more granular detail. At the bottom of each widget in your reporting, you can click on a blue call to action to get into more information. For example, under acquisition reporting, you can click on “view new users”.
There are some new metrics to be aware of under user reporting as well. These include:
- Engaged sessions – This is defined by any user who has been on your site for 10 seconds or more. If they leave before 10 seconds is up, this is defined as a bounce.
- Engaged sessions per user – This is the sum of the total number of sessions per user averaged by total user count. This measure will be something for marketers to watch trends over time – a higher ratio means more engaged users.
- Engagement time – Engagement time diagnoses screen sleep time, or captures the time in the foreground for a mobile device, to determine how a user is engaging with your content.
Behavior reporting
Behavior reporting is more streamlined under Google Analytics 4. It is simply broken down into events and page views or screen views.
The Views by Page Title and Screen Class report is essentially a replacement for the old All Pages report, which is one of the most viewed reports in Universal Analytics. In a detailed view of the new report, you’ll notice some metrics are missing, such as entrances, exits, bounce rate, and average time on page.
This is one of those areas that perhaps will undergo more development over time. While the new engagement time measure may be able to replace bounce rate, there is currently nothing to show your landing pages and exit pages without using a workaround such as BigQuery.
Technology reporting
Technology reporting gives you insights into the technology your users are channeling to get to your site or app. This includes device types, browser types, and operating systems, among other things. There are two sections in this report: web technologies and app technologies.
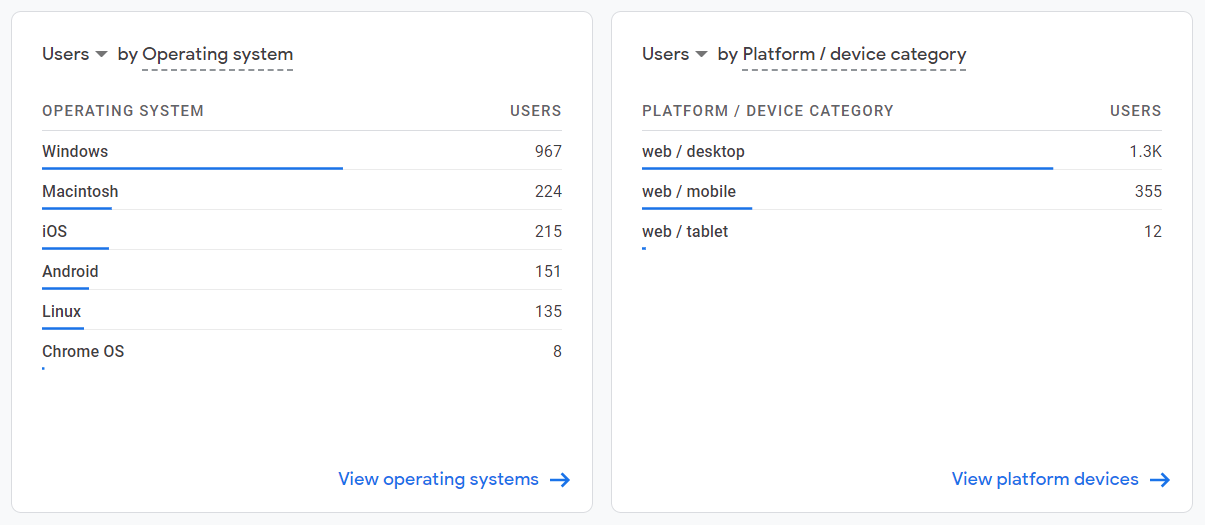
Google Analytics 4 has brought in mobile app reporting that previously came under Firebase. This includes details like app version, release, device model, and platform (iOS vs. Android, for example).
Up Next: Transitioning to Google Analytics 4